During the last few months I had a number of customers report that their WordPress backend was running slow. This seemed to be very annoying, with some requests taking well over 5 seconds. I suspected a bad plugin was causing the bottleneck. Typically the first troubleshooting step is to create a staging site and deactivate plugins one by one, however this is very time consuming so I decided to search online in which i can do this in an efficient manner and saving my time troubleshooting using WP-CLI on production and then i came across an amazing method shared by Anchor Host which i am gonna shared with you today.
With any WP-CLI command you can tack on –skip-themes or –skip-plugins as flags. Combine that with –debug and you can get comparative time results. A simple example is to run wp plugin list –debug and compare output to wp plugin list –skip-themes –skip-plugins –debug. The output should have a line containing the total time it took to run the command:
- Debug (bootstrap): Running command: plugin list (4.522s) – With plugins
- Debug (bootstrap): Running command: plugin list (1.113s) – Skipping plugins
Skipping specific plugins
You can mimic deactivating individual plugins by specifying a plugin slug like wp plugin list –skip-themes –skip-plugins=jetpack –debug. This is great for debugging as it doesn’t actually deactivate anything. It simply skips that specific plugin for a particular WP-CLI request. I wrote the following bash script to loop through the activated plugins and output the running times with each plugin skipped.
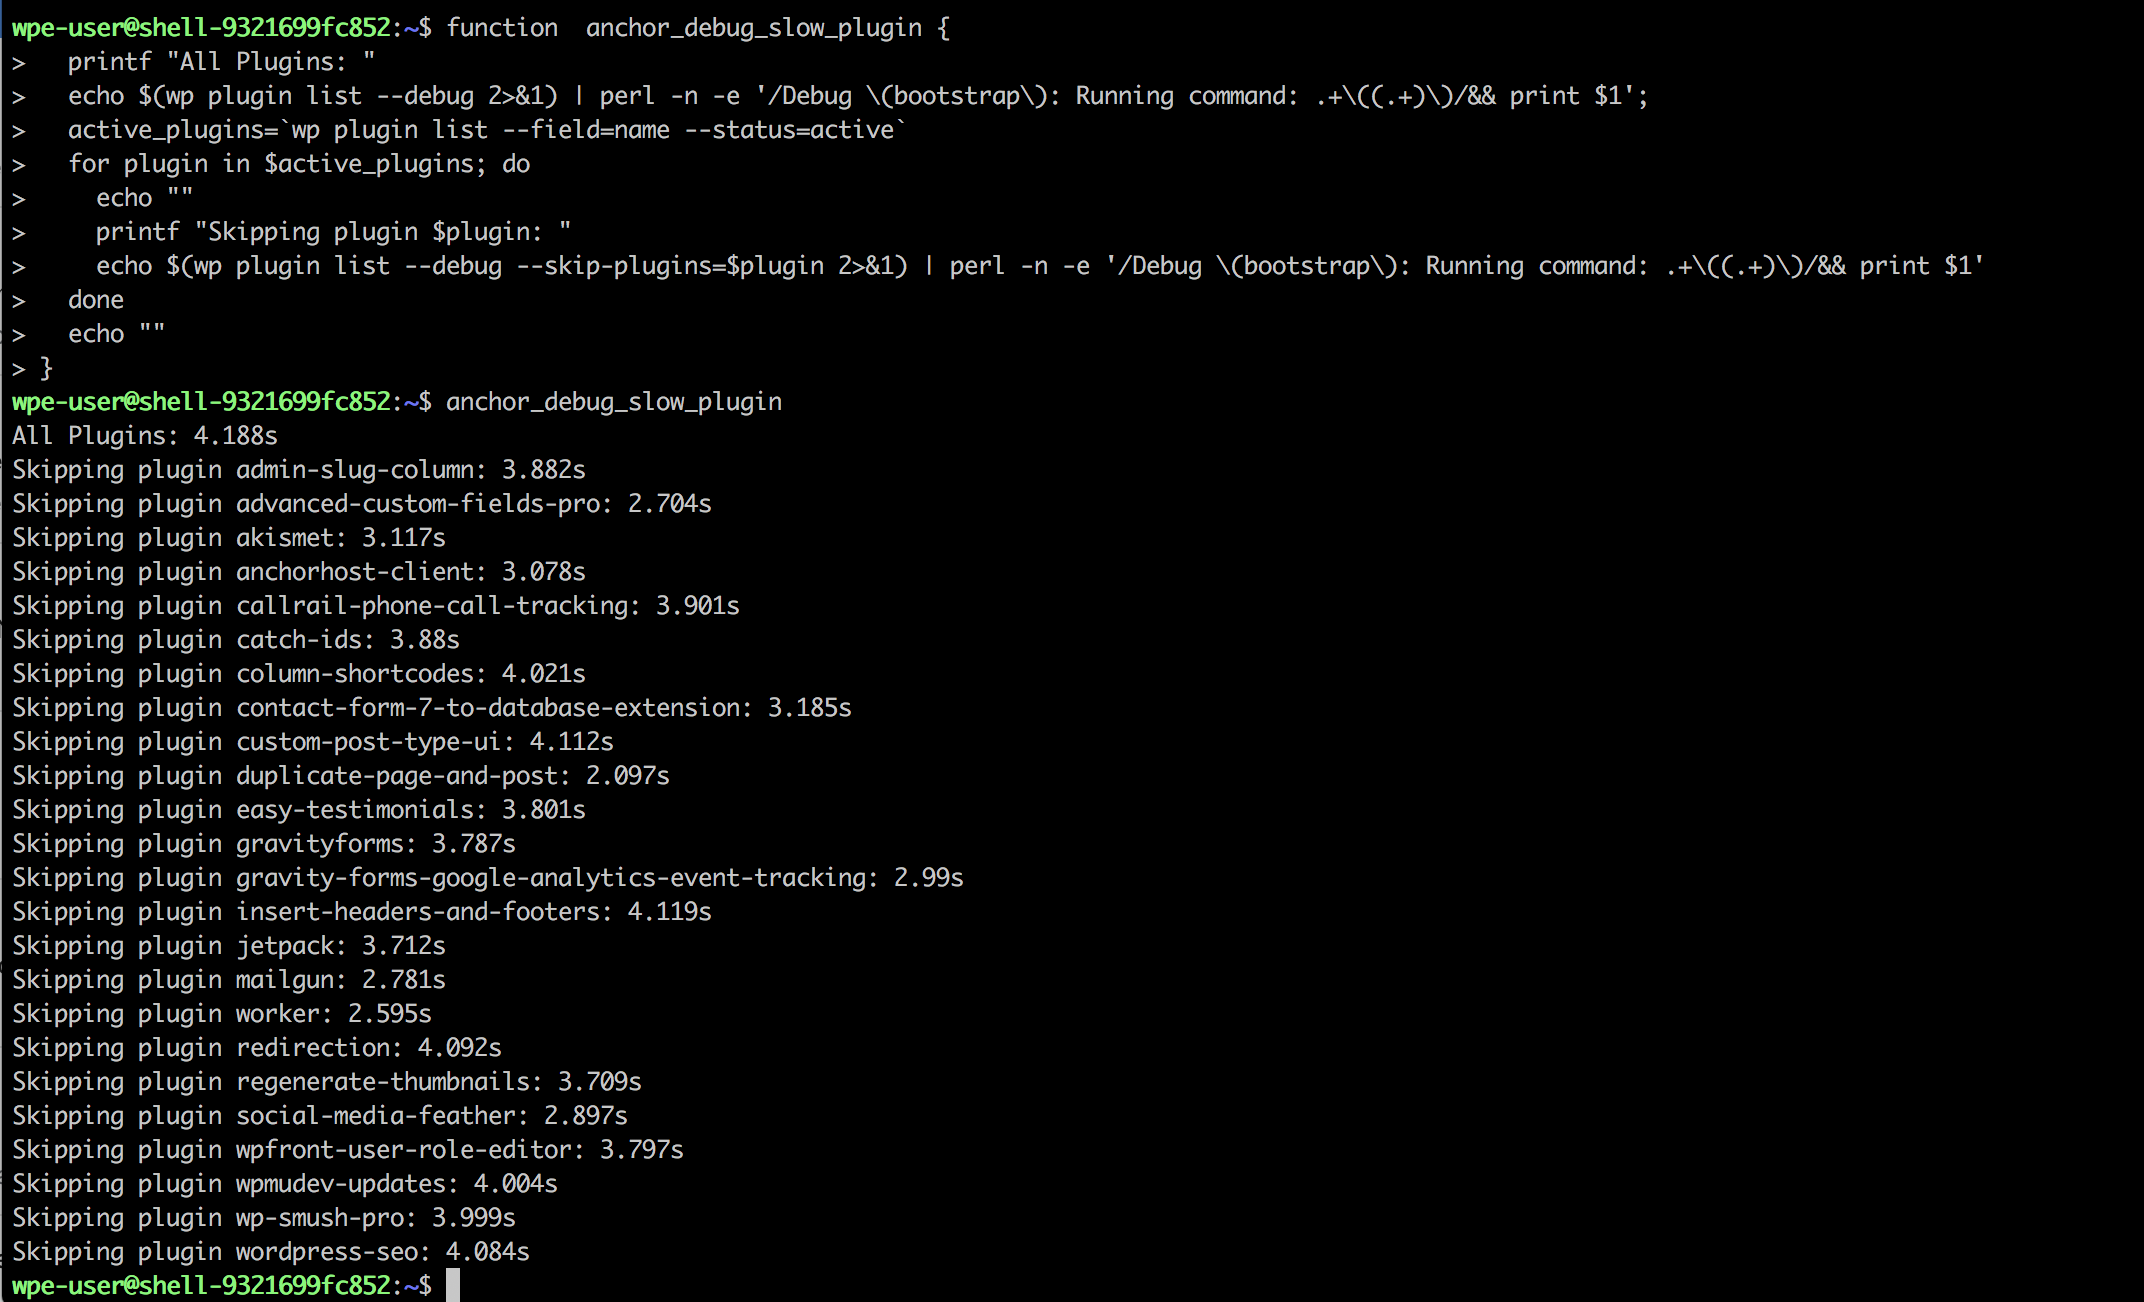
function anchor_debug_slow_plugin {
  printf "All Plugins: "
  echo $(wp plugin list --debug 2>&1) | perl -n -e '/Debug \(bootstrap\): Running command: .+\((.+)\)/&& print $1';
  active_plugins=`wp plugin list --field=name --status=active`
  for plugin in $active_plugins; do
    echo ""
    printf "Skipping plugin $plugin: "
    echo $(wp plugin list --debug --skip-plugins=$plugin 2>&1) | perl -n -e '/Debug \(bootstrap\): Running command: .+\((.+)\)/&& print $1'
  done
  echo ""
}
anchor_debug_slow_plugin
This revealed that the biggest impact was coming from Duplicate Page and Post plugin.
With that plugin deactivated, rerunning the script shows overall a 2 secs faster load.
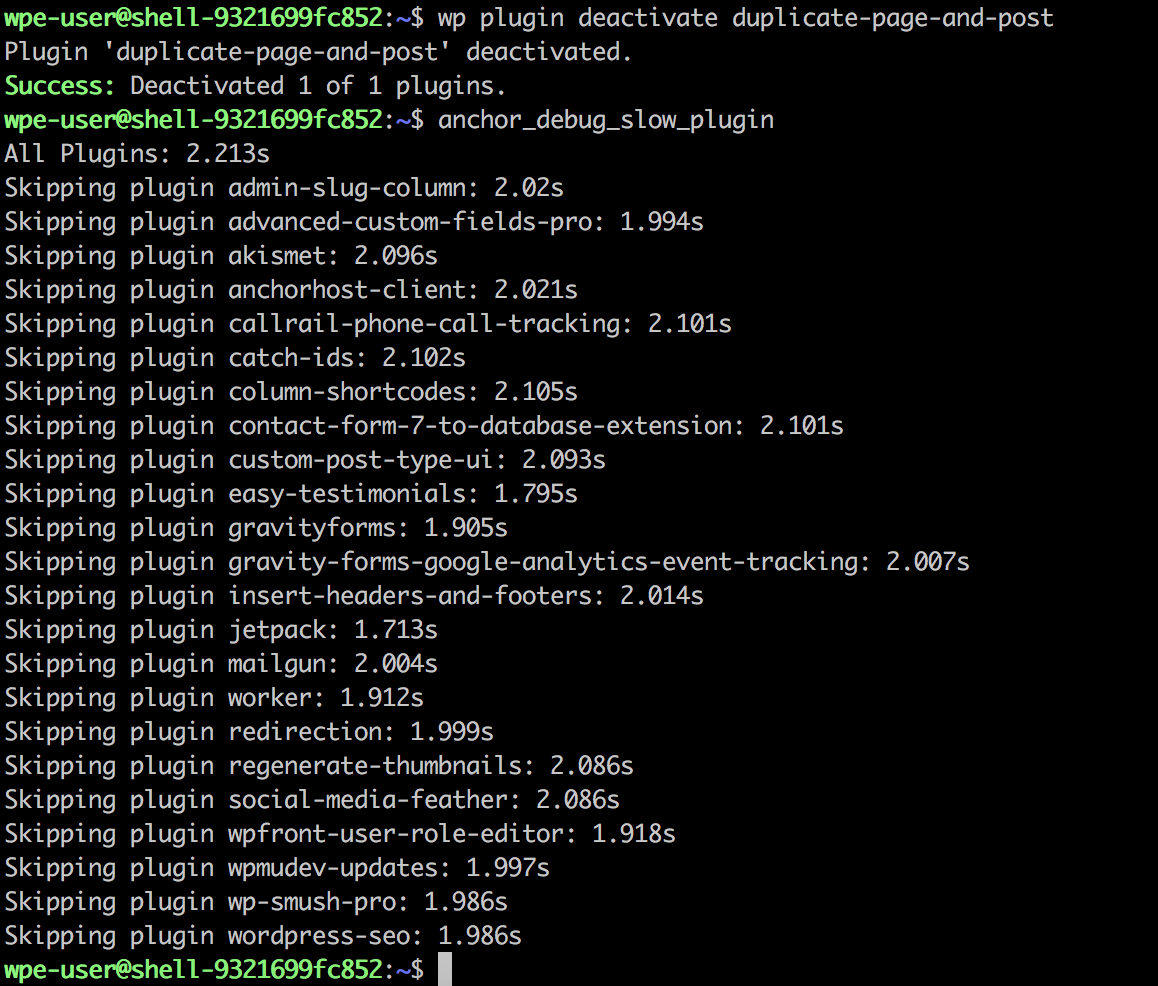
Turns out this 2 sec load appears to be from an external call the plugin is making as noted in this support ticket: https://wordpress.org/support/topic/http-get-request-to-cloud-wp-org-using-dpp-2-1-1/.
More elaborate performance testing available
While this bash script can catch major bottlenecks it’s quite crude. For elaborate performance testing I’d check out the package profile command: https://github.com/wp-cli/profile-command.
Content retrieved from: https://anchor.host/identifying-bottleneck-plugins/.